
At any time, it is the duty of decision-makers across the globe to keep people safe, protect their economies and safeguard society.
This is even more important during a complex and challenging situation like a pandemic.
The coronavirus pandemic has thrown into sharp relief the connections which exist in our world.
Systems thinking looks in detail at a complex situation but also probes some of the underlying assumptions and structures determining these decisions.
We know that at a local government level and international level on many different issues, people are already thinking in this way and doing fantastic work as a result.
It was within this context, and as part of ongoing training for colleagues in government, that I was asked to deliver some training on systems thinking.
Getting started
I started by outlining the core concepts behind systems thinking. If you want an overview, my colleague Adam recently explained 3 concepts in his blog post.
We then began our first exercise. Using an online tool, which enabled us to all participate, we drew causal loop diagrams of systems affected by a complex issue like a pandemic.
A causal loop diagram is a representation of actions which uses positive or negative connections to show how they relate to each other to create an outcome.
It’s best to start with an easy-to-understand example of a causal loop diagram. Here is one which shows how I typically spend my Easter - consuming and buying chocolate and jogging to counteract the effect.
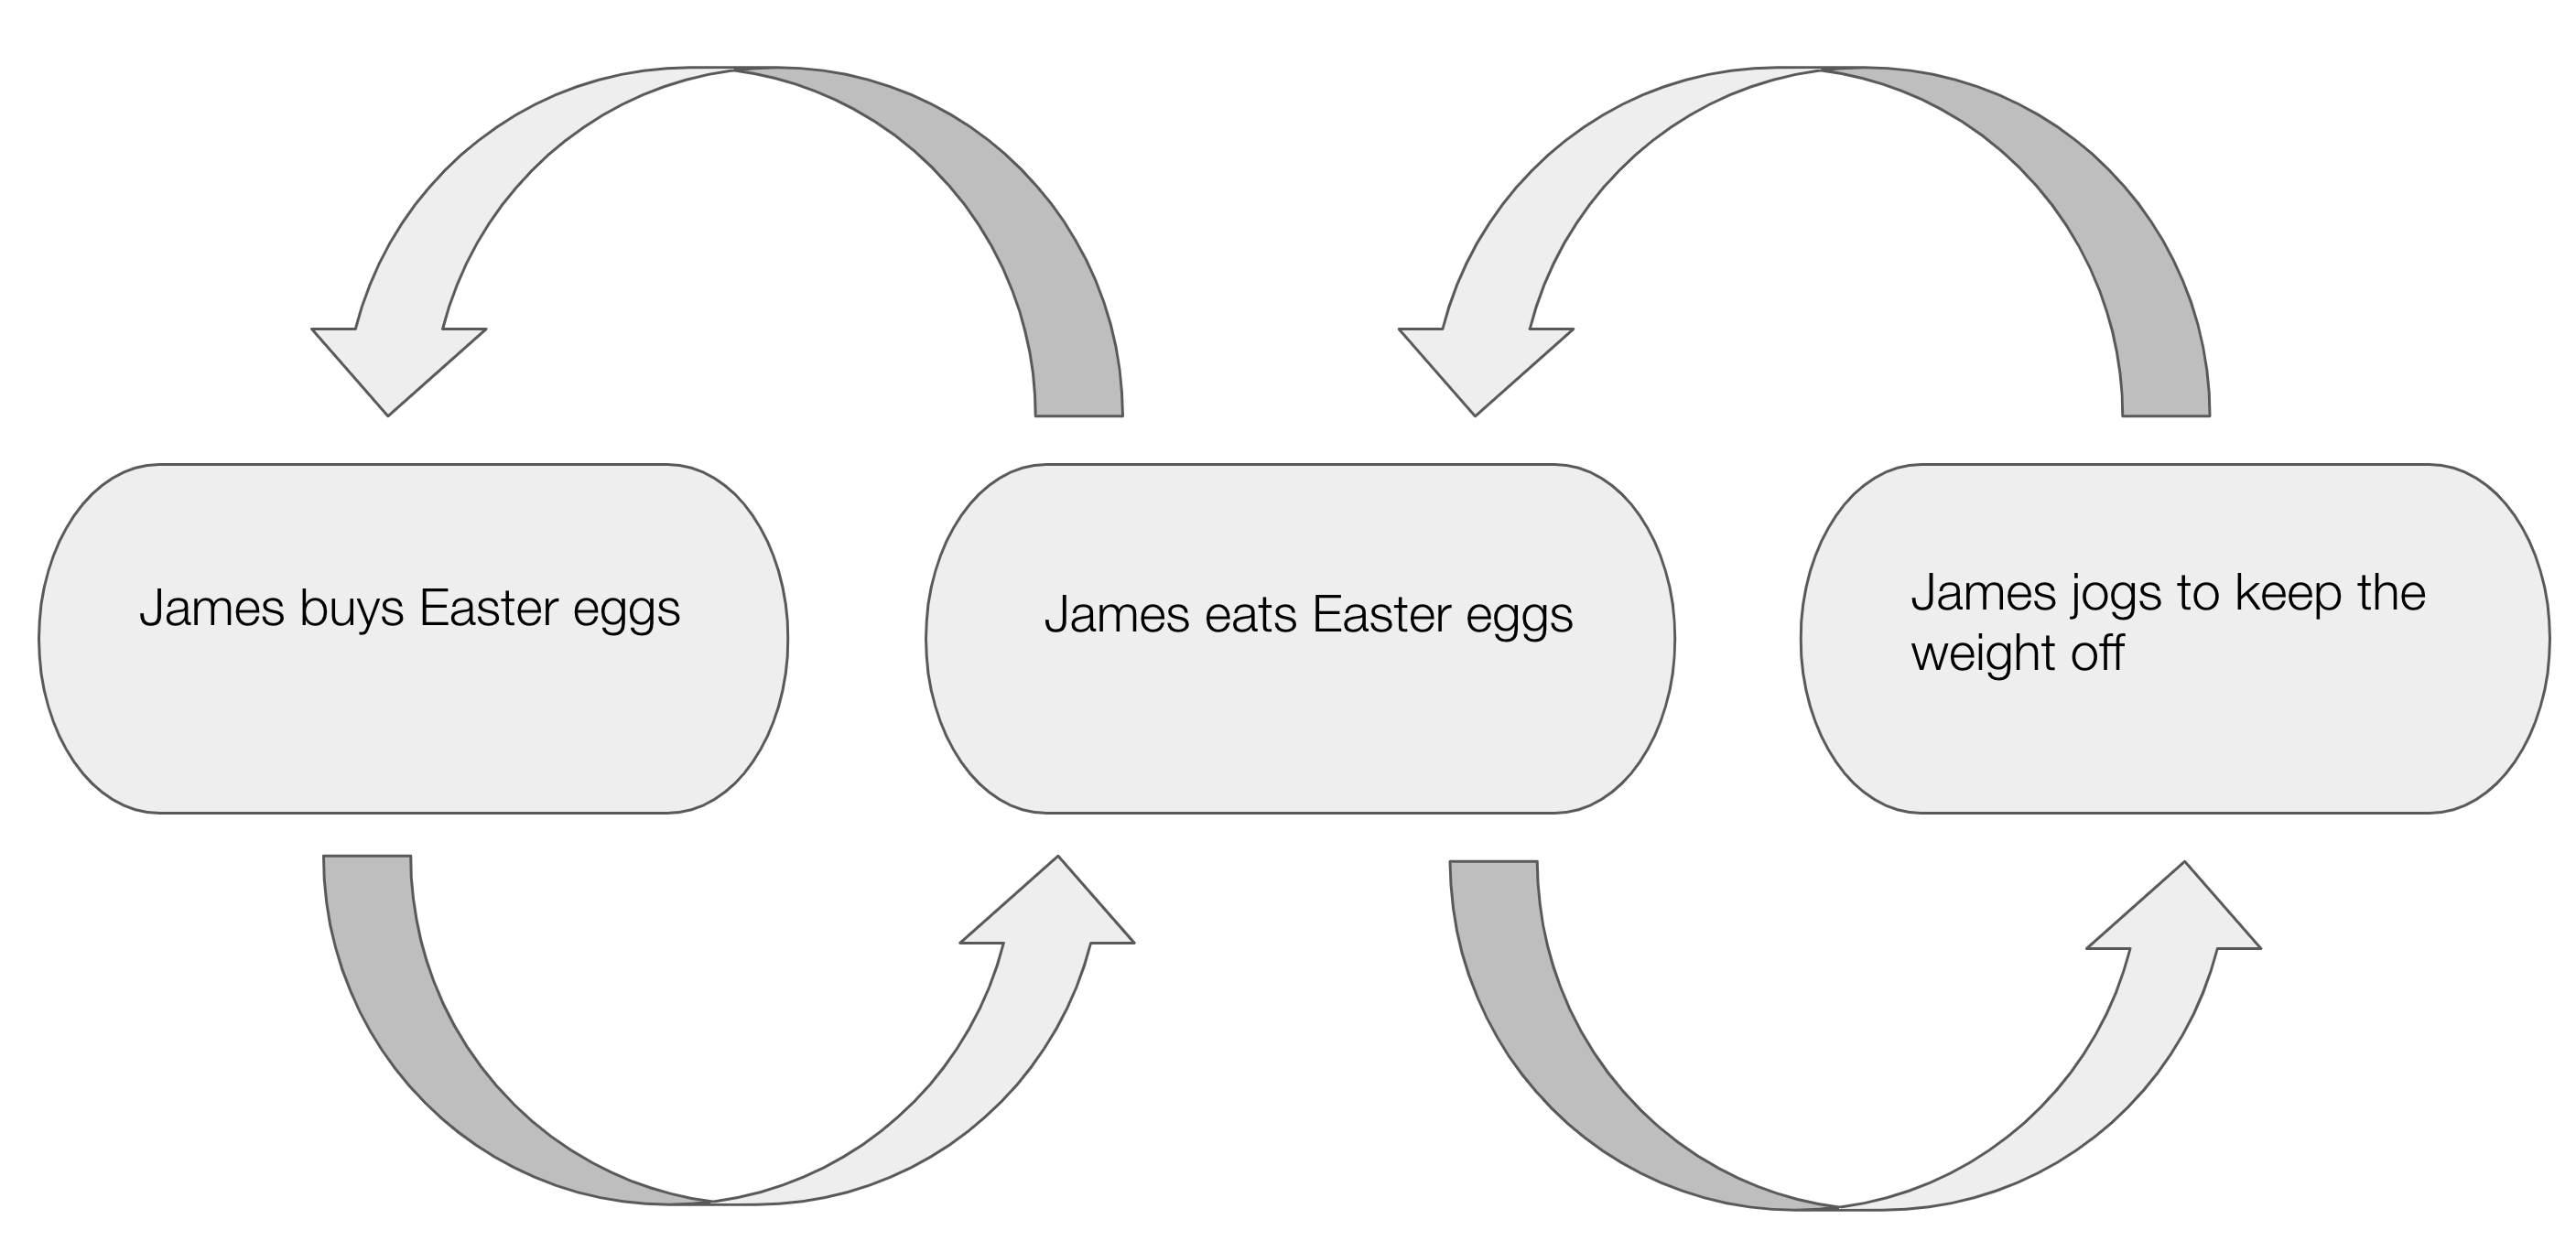
As I eat more chocolate, I buy more chocolate and as I eat more chocolate I jog more to keep the weight off. This is an example of a balancing loop. It goes to show how a causal loop diagram is a way to represent a process in a simpler and more accessible way than writing it out.
Once the concept was understood, we created a causal loop diagram for health, one for society and one for the economy.
This kind of session would be best run in a physical setting with whiteboards, post-its and markers but I found myself pleasantly surprised by how well Miro and Sketchboard worked to draw these sorts of diagrams and get to grips with systems thinking methods.
The breakout groups took up the bulk of the time of the workshop as we determined the different actions and then made connections between them.
One of the main benefits I see in creating causal loop diagrams, as is true for other systems thinking methods, is that by visualising relationships, we build group understanding of the complexity in a way which is accessible and open to scrutiny.
The diagrams help to create a common language which is a synthesis of all the causal relationships within the system.
The diagrams showed the messiness of these systems and the conversations brought out some aspects which aren’t at the top of all our minds - like, for example, the impact on and from changes to birth rates.
How others use causal loop diagrams
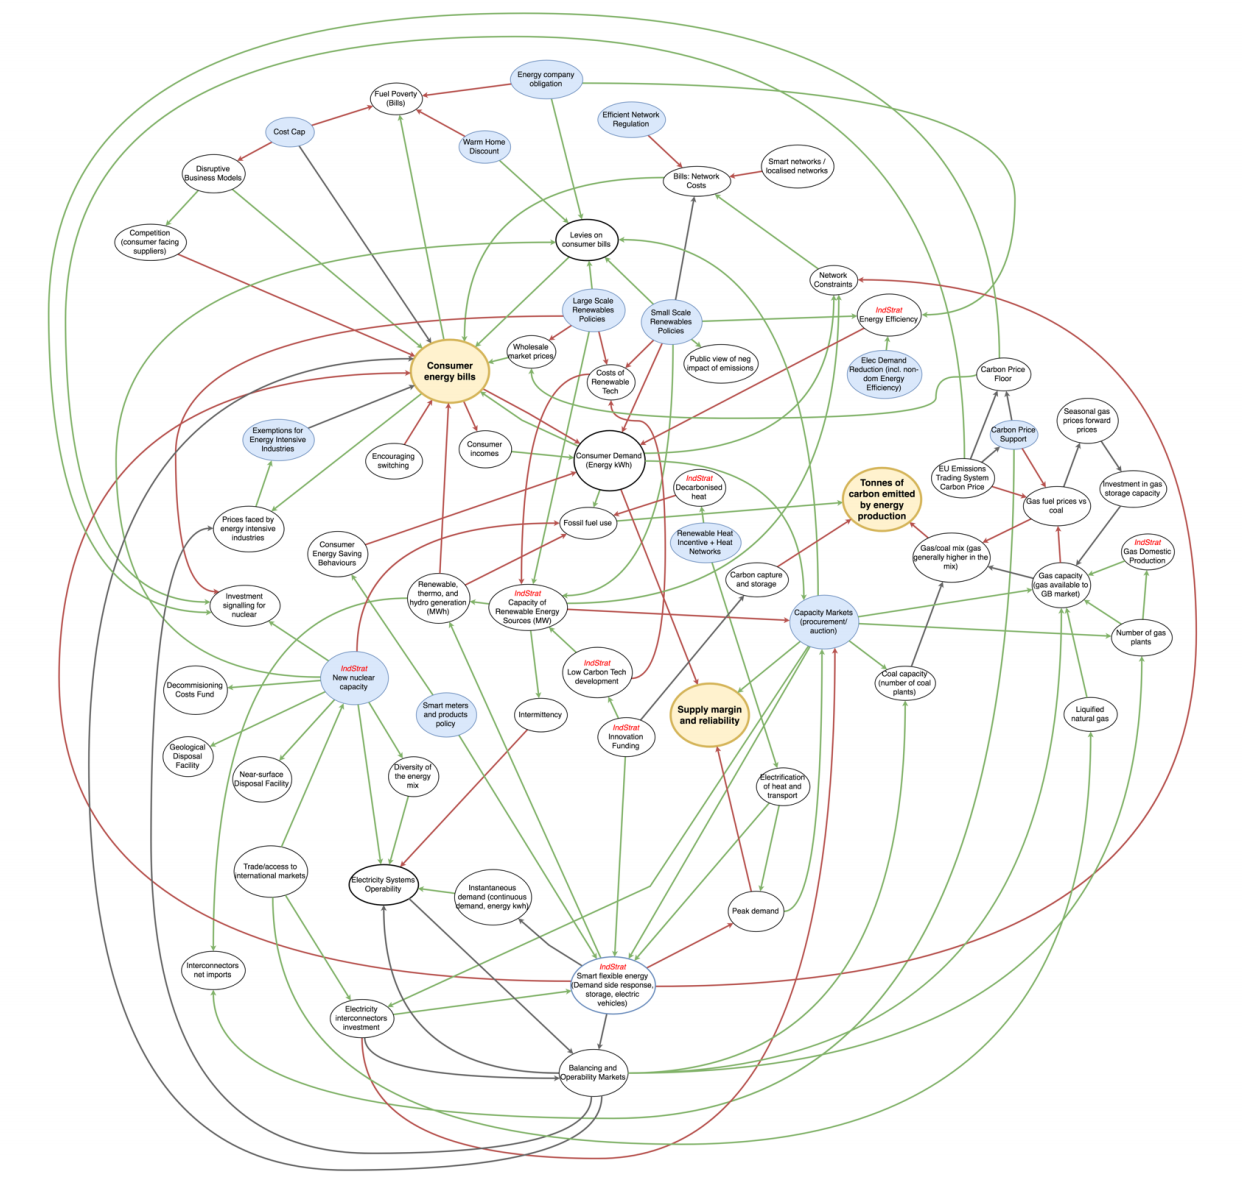
We then looked at an example causal loop diagram for the energy system developed by the Centre for the Evaluation of Complexity Across the Nexus (CECAN) for the Department of Business, Energy and Industrial Strategy which shows some of the causal relationships at play in creating an energy market which is sustainable, secure and affordable.
I like this model in particular because it is comprehensive. It doesn’t have a huge number of links but it has a lot of nodes (a point in a network or diagram at which lines or pathways intersect or branch).
I recommend looking at the diagram in the link above for a better resolution.
Tip of the iceberg
We then used the iceberg model to explore some of the deeper reasons for events occurring such as the underlying patterns, structures and assumptions.
The iceberg model reminds us that an action itself is only part of the reason why something is happening in the same way the tip of the iceberg shows only a fraction of the whole.
I find the iceberg model fits quite neatly with creating ‘issue trees’ - to move down the iceberg and understand the underlying structures and mindsets: ask yourself and your group “why?”
By doing this with your group you will unearth some of the tensions beneath the events but which have an increasing amount of leverage on the events. In practical terms, this might mean a group looking at toilet paper shortages focus their attention on the role of misinformation on social media in causing widespread panics.
By the end of the training session, all those who had participated agreed that these methods can help develop the kinds of systemic solutions which can help tackle some of our most complex challenges.
Our role
It is the job of public servants across the world to present evidence and give advice to ministers.
This process will often employ evidence from a range of disciplines, from economists to epidemiologists, ethnographers and beyond.
The evidence needs to be detailed and factual but we also need a framework to understand all this information. That language is systems thinking. It isn’t here to displace any of the other sciences but to bring them together.
The very best thing people in the public sector can do it to embrace complexity - not to be tempted to reach for simple decisions.
James’s Top TipDiversity of thought is so important, particularly when working together on a causal loop diagram. This is something you can explore with your own team. Which number is more unlike the others?
The question is deliberately ambiguous and your answer is determined by your perspective:
When I asked the participants this question, we had an array of answers and it helped them to peek into how their colleagues’ minds are wired - some were lateral thinkers, others mathematical, and so on. |
6 comments
Comment by geoff elliott posted on
The diagram appears to be more like a cognitive map (ackerman/eden) than a casual loop diagram. See also the work of Lindstone/Mitroff and why certain types of people WILL always a specific perspective.
Would it be useful to set the different sensemaking diagramming methods, eg cognitive mapping; systems mapping; influence diagrams; causal loop diagram(Sterman/Forrester) etc. Often people confuse the role of these methods, eg, an influence diagram is often labelled as systems map.
Comment by Alec Fraher posted on
long and short run feedbacks may and may not be causal, it is a matter of who's perspective counts and who defines the boundary - a lot of modelling is brilliant in conception but poor in implementation and accounts for about a 60 % match to what's really going on. Time-value consistency and time-separable histories remain problematic.
Comment by Alec Fraher posted on
It occurred to me that the relationship between corona 1 9 and other variations rests with their ability for similarity transformation and the relationship between noncommutative and commutative properties - for a perspective on fractal similarity see Nicholas Cotton et al 'Convoluted Fractals' 2015 as well as staples like Emma Noether
Comment by Alec Fraher posted on
what are the fractal(s) of this avoidance architecture?
Comment by Alec Fraher posted on
see https://doi.org/10.3389/fnbeh.2020.0019
and 'the problem of trust' by Adam Seligman
Comment by Alec Fraher posted on
it is worth looking at what BOJAN RADEJ is saying, look him up 🙂